Health research often highlights the negative. What are people not doing to safeguard their health? Who isn’t getting care? Where are we going wrong? While the importance of examining health disparities cannot be dismissed, in this issue of Public Health Directions we focus on the positive health data compiled by PHMC’s Community Health Data Base (CHDB). In 2010, CHDB conducted its biennial regional telephone survey examining the health, well being and healthcare experiences of more than 10,000 residents of Bucks, Chester, Delaware, Montgomery and Philadelphia Counties. CHDB found indications that many people are choosing to eat healthy, quit smoking and take other positive steps to increase their overall health and fitness.
Figure 1. Percentage of Philadelphia Adults Who Reported Excellent, Very Good, or Good Health, by Neighborhood

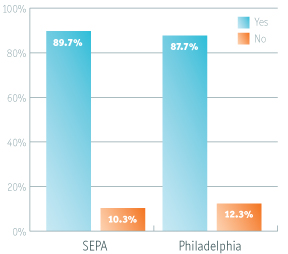
Adults who have a regular source of care:
- In Southeastern Pennsylvania (SEPA), nearly 90% (approximately 2,691,000) of adults report that they do have a regular source of care.
- In Philadelphia, about 88% (approximately 991,400) of adults report the same.
Figure 2. Adults Who Have a Regular Source of Care, SEPA, 2010

Adults who exercise three times or more per week:
- In SEPA, 60% (approximately 1,800,000) of adults exercise three or more days per week.
- In Philadelphia, 58% of adults (approximately 655,900) exercise three or more days per week.
- Across age groups, 62% (approximately 263,300) of adults ages 18 to 39 exercise three or more days, 57% (approximately 140,800) of those who are 50 to 59 years of age exercise three or more days, and about half (51% or approximately 50,100) of adults 75 years or older exercise three or more days per week.
Adults who do not smoke:
- In SEPA, 80% (approximately 2,383,900) of adults do not smoke.
- In Philadelphia, 75% (approximately 841,500) of adults do not smoke.
- Older adults in Philadelphia are less likely to smoke. Of those who are 75 years or older, 92% (approximately 89,400) do not smoke.
Adults who quit smoking:
- In SEPA, of those individuals who have smoked 100 or more cigarettes in their lives and no longer smoke, 91% (approximately 695,500) quit more than one year ago and still do not smoke. Nine percent (approximately 66,500) quit within the past year.
- In Philadelphia, of those who smoked at least 100 or more cigarettes in their lives and no longer smoke, 88% (approximately 220,500) have quit for longer than one year. Twelve percent quit within the past year (approximately 30,300).
Adults who report excellent, very good or good health:
- In SEPA, 84% (approximately 2,512,700) of adults report their health status as excellent, very good or good.
- In Philadelphia, 77% of adults (approximately 873,200) report their health status as excellent, very good or good.
- Younger adults have a higher percentage of excellent, very good or good health status compared with those of older adults. Ninety percent (approximately 375,600) of those 18 to 39 years of age report their health status as excellent, very good or good compared with 65% (approximately 64,600) of those who are 75 years of age or older.
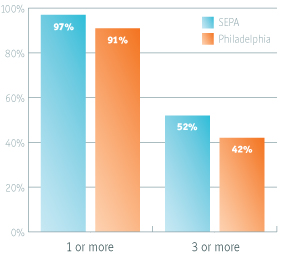
Adults who eat servings of fruits and vegetables:
- In SEPA, 97% (2,827,856) of adults eat one or more servings of fruits and vegetables per day. Fifty-two percent of adults (approximately 1,502,900) in SEPA eat three or more servings of fruits and vegetables.
- In Philadelphia, 91% (1,031,230) of adults eat one or more servings of fruits and vegetables per day. Forty-two percent (approximately 459,300) of adults eat three or more servings of fruits and vegetables.
Figure 3. Number of Servings of Fruits and Vegetables Eaten Per Day, SEPA, 2010

Adults who saw a dentist in the past year:
- In SEPA, 70% (approximately 2,086,000) of adults have been to the dentist within the past year.
- In Philadelphia, 61% (approximately 682,800) of adults have been to the dentist in the past year.


